Redaction and facial recognition certainly relate to security. In one the text is blackened for security and in the other we lose some security as computer programs are able to recognise us in crowds. I find it worrying how much is being spent in this field and wonder how long before we start seeing any of the negative side. At the moment we can untick this option on Facebook.
Face finding was more fun to explore – its almost like looking at clouds again. I’ve been seeing faces for years in patterns – but I’ve also been a face-watcher for years since my mother took me to an art show and to deal with my boredom she sat me down outside on the stairs and told me to watch people instead. They were more interesting to me and I haven’t stopped.
3D imaging is an interesting challenge for me and I enjoyed this week’s lesson. I downloaded 123D and had a play but certainly experienced some of its limitations with a lot of background, and at times some of the back of the image was missing. This app was a phone app – I would have loved to have been able to upload images taken by my camera to see if I could get better results. Due to time limitations I was not able to experiment with Meshmixer.
I enjoyed exploring the cultural heritage offerings at https://sketchfab.com/models/categories/cultural-heritage and can certainly see how useful they are in learning. It is certainly such a new technology that there are not many collections taking it up yet. I look forward to seeing it happen with historical fashion – so many times we complain as we only see one part of a garment which can be frustrating when the back and front can be so different. Museum of Victoria has so many interesting objects but only used this for its paleontology collection.
This week’s discussion in DIY web archiving reminds me what I do not like about internet and computers – the games. I feel so old-fashioned as I have resisted playing computer games my whole life and everyone must feel I am weird as I actually collect old-fashioned games that people played outdoors in the 18th and 19th centuries. So while you are playing games on the internet I’m outdoors teaching children how to play bat and trap, croquet and more.
But back to the topic! I actually really love the Wayback Machine and use it all the time. So often I’m finding dead websites in my historic costume research and this is my first go-to place. I’ve never really explored Pandora but believe that our old website is stored there. I wish I could update it as we’ve corrected a lot of the information since then. It certainly raises the question about what to do when the information archived is now considered wrong – how do we get it corrected? Is it right that misinformation can exist because of our desire to archive everything?
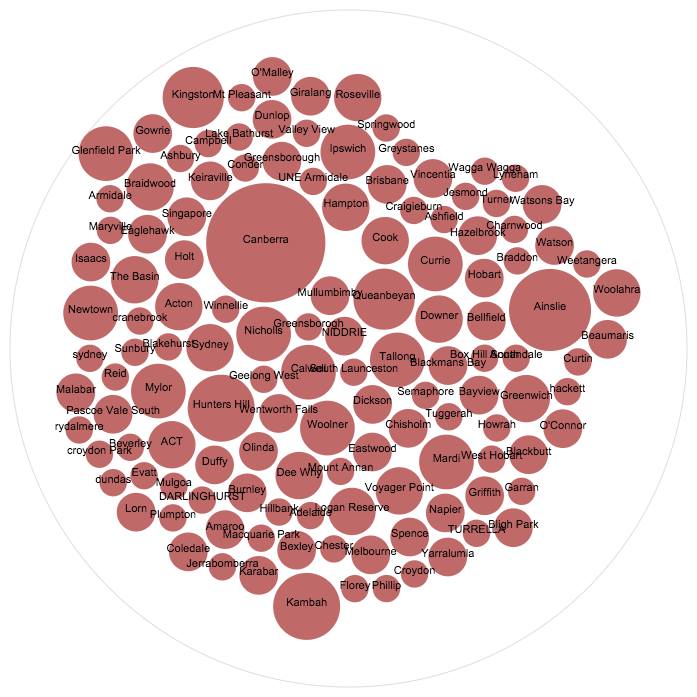
I like geocoding but find it becomes a mess when you play with a large dataset. I liked using fusion tables but options are limited for first-time users. A negative to exploring all these options is the creation of accounts all the time. I so wish that as first time users we could just explore the options. Every time I am asked to open an account, whether it is free or otherwise, I want to run away. Why can’t we open an account when we know more about the option?
Carto looks good and looks like a possibility to use for my data except that somehow my data wouldn’t map – it’s geospatial data wasn’t identified and I need to learn more in order to do this properly. Fusion worked like a dream so is probably safer for me to work with at this stage though I’d like to get Carto working one day.
So many new possibilities emerge for analysis and representation when we look at cultural heritage data in a digital form. This week I learnt all about how data visualisation shows statistical and numerical data in different visual ways and how useful it is for examining large datasets. It was also interesting to learn about infographics and learn how they tell stories to a particular audience but don’t actually use data – certainly handy for those who like pretty pictures. With the US elections happening right now we’re being exposed to a whole lot of visualisations, though I’d be very wary of where all the data is coming from. I’d be labelling most of these to be persuasive visualisations right now. Seeingdata.org linked through to a lot more explanations and possibilities to explore.
I was impressed by https://www.silk.co/ but restrained myself from exploring further as I am already using Omeka.net for another project.
I have been amazed by how many tools Tim has introduced into my life and whilst at first I want to use them all, time and reality steps in and I have go back to the basics.
I enjoy being able to look back and see what was happening on a particular day in history. Analysing speeches in the ways Tim recommended has been fun, although I find listening to old speeches even more fascinating – the way politicians spoke in the past was so different from today and some of the words they used would be considered too formal and stuffy.
I love Edmund Barton’s 1901 speech that came up when searching for the word ‘’vulgarism’ at Explore the Election Speeches– in fact, this was the only result that came back.
Will you not return men of principle who will uphold the dignity of the Parliament of a continent. An an old Speaker, I appreciate this need. Hope and believe Parliament will not be degraded by vulgarism and disorder. More and better business will be done, if done decently and in order.
QueryPic wasn’t working for me and kept on timing out. I’ll have to come back to it another day. Google’s Ngram gave me better results showing what I expected when I put the words refugee, humanitarian and illegal.
My original project intended to add extra dimension to a website that I designed and continue to maintain to promote Jane Austen Festival Australia, an annual event that I organise to foster the learning of dance, sewing, theatre, writing, fencing, period games, and more during the life of Jane Austen. In this project I wanted to take my love of learning across to the website and turn it into an educational resource. The original intention was to feature a collection of antique objects that is going on display in 2017 and that I’ve been cataloguing on an Omeka.net collection website. Each item in this collection was going to be used as a conservation resource with 3D and zoomable pictures showing areas in need of conserving and how to conserve them, patterns to make a copy of the object, links to suppliers and recommended reading, and so on. I owned all the items, so there was no issue of copyright to worry about.
What I learnt, what went well and what difficulties did I have?
Suffice to say, I realised the project was just too ambitious to fit in amongst a full-time 5-unit semester load, and it has been put on hold. I found out early on that my IT skills are lacking in the 3D department and I have a lot more to do before I share my attempts on a public forum.
I still retained my interest in developing the festival website and had a sudden last-minute brainwave that Tim didn’t think was too crazy. I started this annual event from scratch in 2008 and have been the sole administrator and still have all my attendance records and ticket sale data. Why not play with this data and get a better picture of how the festival was going? It was easier said than done though, as after getting all the data into lots of pretty charts and tables I realised the most important issue of all – privacy. My .csv files contained personal names, addresses and telephone numbers and even though I applied filters when preparing the tables and pie charts, in some formats the end results showed up information that I had filtered out. It was not safe to have any unknowns with private data so I had to start it all again and clean up my data.
Playing with the data was fun, though I found the examples I produced in RAW very pretty but not suitable for what I had in mind.
An example of RAW data produced at http://raw.densitydesign.org . Gardiner-Garden, 2016.
Google Fusion Tables ended up satisfying most of my needs, however not everything went smoothly. The first sign of trouble came when I tried to geocode my data so I could place all the attendees on a map. In order to produce mailing labels for attendees I had set up my original spreadsheet with city, state and postcode in separate columns. For geocoding to work all this information had to be combined in one column. Off I went to get the Merge Values add-on for Google Sheets. Without this add-on a merge of three cells would result in a merge with only the left cell’s contents remaining.
One adventure was not enough for me. I spent a while getting an API key and installing the Powerhouse Museum Plugin only to find out it wasn’t displaying the objects how I’d anticipated, even though I put in the correct html. [phm-grid cols=4 rows=4 v_space=1 h_space=1 thumb_width=240 thumb_height=240 random=true parameters=”title:chair|description:New South Wales”]
I will have to see if I can get API to work instead, but that is another large project to go on my to-do list. My html problems with the WordPress plugin may have been because the plugin is two years old and no longer supported or it could be because I had an incompatible wordpress site. I think its a bit of both. My Powerhouse Museum test page that is not on obvious display to the public can be seen at http://janeaustenfestival.com/costume/. Please note, the page contains written information that is not supposed to be there.
And on to an even bigger adventure that has halted work for now. I installed the Moove plugin to track user activity on the website to see if the new additions brought in a larger audience. Moove looks very useful as it tracks date/time, user name, activity (visited/updated), client IP, client location (by IP Address) and referrer url of visitors to the website. Sadly this installation has resulted in a white screen of death on the admin side, and I will now have to log in with an ftp server to find the offending plugin and delete it. I’m still keen to see if this plugin will work, as it also works with a membership plugin.
How successful the project was in meeting your original aims
I’m pretty happy with most of what I have done so far at http://janeaustenfestival.com/about/history/ but do note it is not finished because I am currently locked out of the website admin and have more charts and tables waiting to be added. By analysing this data I’m getting a better picture of how my event is growing. The audience is increasing every year, and for a Jane Austen event it was nice to see that each year we seem to get more men. Its early days yet, but maybe with the publication of data that shows our most popular age group is 25 we might get a few more men along?
Some thoughts on how the project might be extended. Did you have ideas you weren’t able to pursue?
This project will be ongoing. I’m keen to get the Powerhouse Museum Application Programming Interface (API) working so that people can view items of this period from the Powerhouse Museum collection. And once I’ve recovered from my first semester of study for over 23 years I’m going to get the original collection idea moving! I’ve already had people volunteer their interest from around the world in helping so it might be quite soon. Crowdsourcing for help gives you a great sense of well-being as you find there are so many others out in the world interested in what you do and keen to help you get it done.
Data can be used to question, inform, and shape your perspective. It can be mined from historical documents, scanned images, government datasets and cultural organisation records. Application Programming Interfaces (API) provide data in a form that computers can understand, and allow us to build new tools and interfaces. CSV files can be uploaded and explored at websites like WTFCSV at https://www.databasic.io/en/wtfcsv/. It’s nice to see my csv collection data file analysed in different ways and gives me instant graphics to use for proposals and reports.
Trove Harvester uses API to save data about newspaper articles to a CSV file for further analysis. This certainly looks like something to explore later on. Cleaning up datasets has certainly been a job I’ve had to do before and normally I ask for help. Finding out about OpenRefine has been useful and I look forward to using it to clear out blank cells, duplicate entries, and typing errors. Unfortunately, the tutorial links in the lesson outline were not working so I was unable to explore very far.
After completing Week 2’s lesson I was left with the belief that the internet was full of people following their passions – and that the online documentation was simply part of that passion. Whether they are finding, collecting or using ‘stuff’ or information, the whole process has taken over our free time. Crowdsourcing is often just a way to finance such activities and gives others an important sense of being part of the whole process.
Week 3’s coverage of online search results is certainly eye-opening and not surprising. I’ve felt that many times my google searches have picked up on subjects I’ve discussed in emails with friends, and that facebook advertisements pick up on topics that friends might share on my feed. I probably do this myself – unfollowing friends who post political views in opposition to my own – and create my own bubble.
Mitchell Whitelaw’s article ‘Generous Interfaces for Digital Cultural Collections’ explores search queries and how much information is withheld when we don’t know what we are looking for. My own experience is rather focused – I very rarely go browsing in online or actual collections. I’m more inclined to book a private session to view a few items, visit a particular gallery to view one part of a collection or follow leads online to find answers for a particular research question. My problems with the easier access to many overseas collections is that they are now deciding what part of the object I want to see. If I look at a garment the museum has already assumed that I wish to view the outside features, and may no longer allow appointments for me to see interior construction details. On the other hand, the online viewing platform has made it easier to identify the items which I will then try to make appointments to view for further investigation.