Another week, another strong feeling that I just don’t have a handle on the digital side of digital heritage. Tim’s paper on Maps and Pins was fascinating, however, it’s the concepts I like, but struggle to get around how to practically tackle a project such as adding faces to Archives searches.
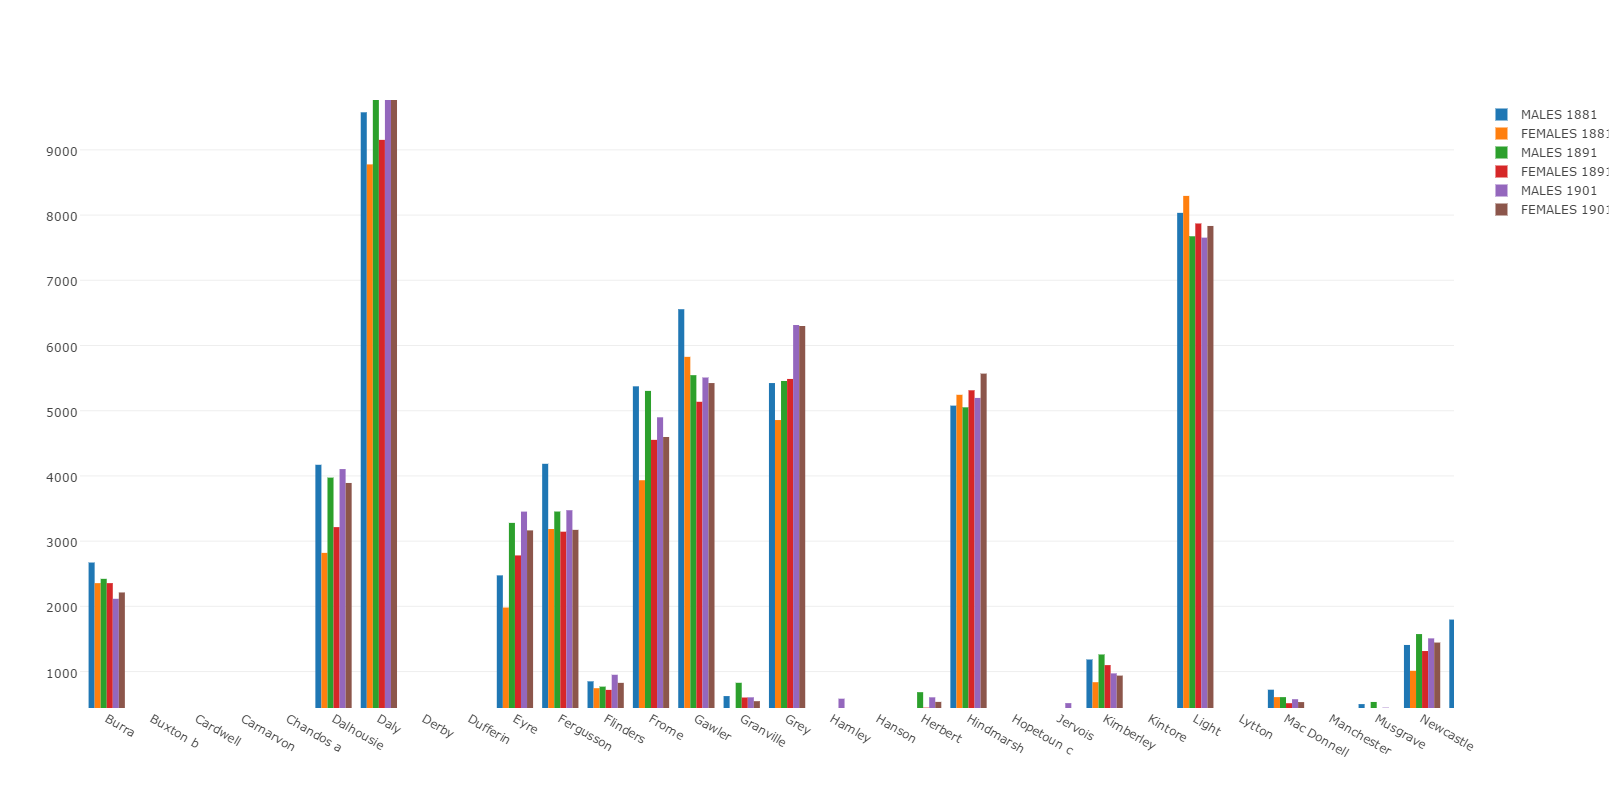
But small steps I guess, and here’s one of them, my first attempt at plotting data with Plot.ly. Ok so that hyperlink isn’t fabulous, but here’s a screengrab of the bar graph from the data representing populations of Males and females in tasmania, broken up by town and year using census data from 1881 to 1901.
Open Refine seems incredibly useful, particularly when looking over the data from the Tasmanian inquests. Using open refine, the ‘free form’ descriptions of inquest findings could be collated and, well, refined to provide more practical information. Really cool stuff, but I still have to get my head around CSV’s, API’s and most other acronyms we’ve run into.
Cheers,
Aiden