I’ve been reading this weeks post carefully, as I’m proposing to create a map for the project due at the end of semester. To be honest I think I’m out of my depth and I’m looking for ideas, particularly when it comes to how to make my visualisation ideas into a reality.
Link to Pilbara test map.
Here’s a heat map I made out of the ACT Cyclist crash data with Carto:
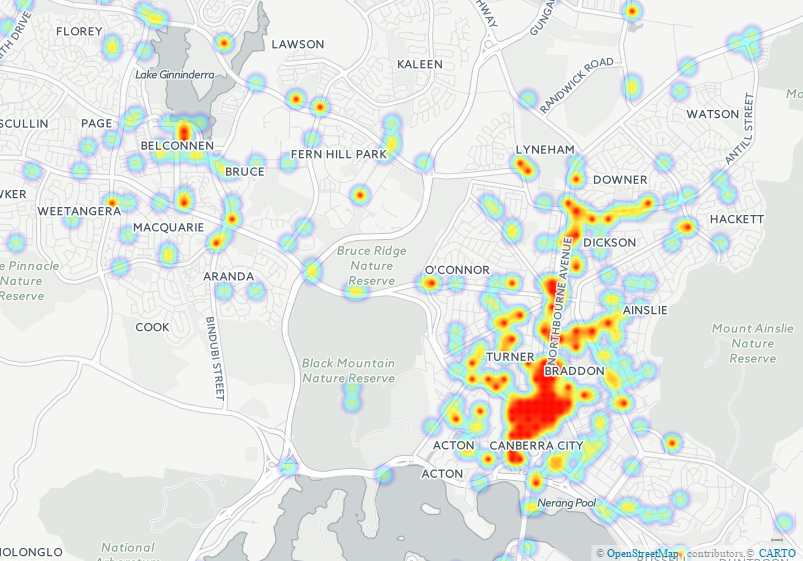
Fiddling with the map settings in Carto seems both incredibly useful, but it some ways, illicit. Just by adjusting how the data is represented, I can paint a different picture, without altering the data. For example, with the heat-map, I can increase of decrease the size value of each crash. Increasing the size of each point, increases the ‘heat-density’ of Northborne Ave significantly. I’m not altering the data, but the perception of the data, but when I’m using a map such as this to represent data viewers might not look at, is there much difference?
I’m currently trying t make a rectified map of Canberra using Map Warper, but I’ll finish my post while the jpg. is loading.
Certainly some interesting stuff this week, and incredibly useful for my project proposal (which I better get back to writing).
Thanks
Aiden