My Brain Hurts

I had to read Humanities Data: a necessary contradiction, by Miriam Posner a couple of times before I really understood her point – which probably makes me a bit thick. The title, of course, says it all – to boil humanities research data down seems at odds with the origin of that data. The analogy Posner uses is actually particularly poignant.

“Imagine that someone called your family photograph album a dataset. It’s not inaccurate per se, but it suggests that this person just fundamentally doesn’t understand why you value this artefact.”

Initially I felt that Posner was at odds with my view that preserving the context of data is essential, but in fact this article supports my view.

This article also has a link to the work of Trevor Munoz and Katie Rawson – Digital Heritage Curation http://www.dhcuration.org/. This is a fantastic site that includes numerous links to scholarly articles exploring issues and concepts relating to curating digital collections. It is well worth a look. You can follow @DHCuration on twitter.

Open Refine is a great tool… I am keen to test this program on some data exported from Emu – the National Museum of Australia’s (NMA) collection database. Like many institutions, the NMA is keen to publish as many collection records on the web as soon as practical. A barrier to publishing collection records to the web can be the quality of the data.

Till next week..

Lisa
 

The Morris Car GIF

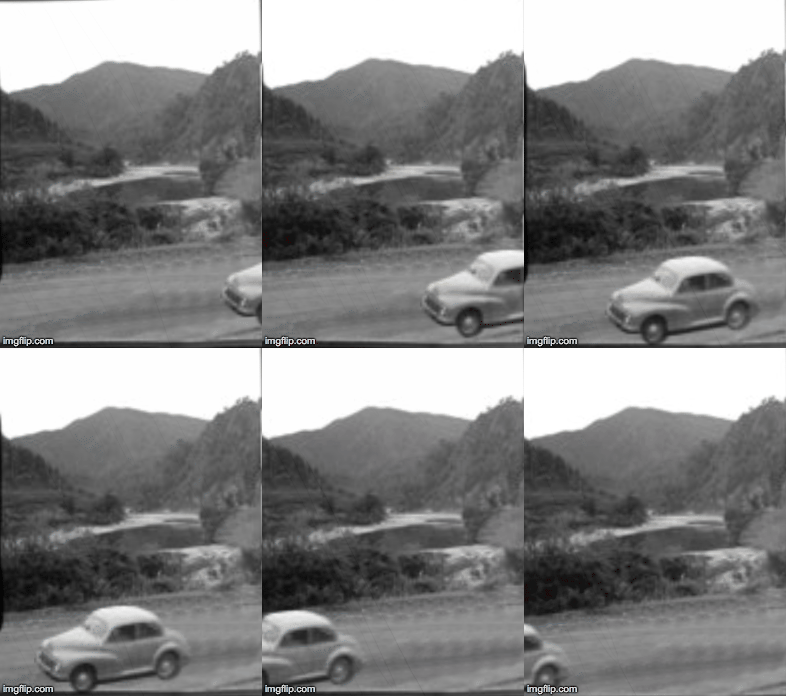
One last thing for the week. I made a GIF. I found that the website and editor for pixlr.com kept freezing so I used a photo editing app instead. I then uploaded the photos to imgflip.com where 13 images were put together to make this GIF. This website also gave me an image HTML so I could put it in my post.

Week 5 – Text Analysis

I am hoping there are no other tasks needed for this weeks reflection, as this post brings my blogging up to date.

I actually find this idea of analysing text very interesting. At first I was like, What the? But by the time I finished reading the articles I could see a very practical use for text analysis. Much like the National Archives uses science, visual analysis and watermarks among other techniques to date the production of paper as well as the origin of paper production. I find it incredibly fascinating that we could use computer analysis to scan text and date writing based on the language used and possibly pin point it to not only a location but similar to a finger print, to an actual author. Truly an amazing thought.

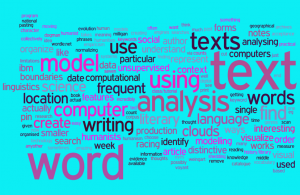
I created a Wordle “word cloud” this week using the text from my week 5 notes. I actually saw a post on Instagram recently from a mum blogger who used a “word cloud” as her image post and asking people what they thought of blogs and if they actually read them. I highly doubt she even knew that the image used was a “word cloud” and until now neither did I.

Screen Shot 2016-09-06 at 12.10.06 PM

I changed the colours of my word cloud using hex colour codes so that they are better suited to my taste. What do you think? I think it is incredibly pretty.

Week 4 – Reflection


Information Overload

The management of digital heritage is definitely becoming more of a concern today then ever before. The problem I feel with digital heritage is that there is just too much. In the past where physical objects would get destroyed due to age, deterioration, handling etc., the collections of heritage available for preservation would get smaller per subject field as time goes on. When it comes to digital heritage as time goes on, the accumulation per subject field becomes more.

It is lovely to save everything but perhaps like trying to save everything in a fire we need to let some things go. As well as a system designed for improving data management we also need a system to dispose of data. Perhaps we could employ a bot for the job?

I had a go a creating a graph using Plot.ly this week. It absolutely looks no different to the graph from the tutorial however I did make this one all by myself, from scratch. #proudmoment Embedding the graph was easier said then done. Firstly, one must enable the private share link and secondly since I have coded this weeks blog in the text format, I needed to change the embedding code from an ‘iframe’ to ‘html’. I also decided we needed some style and colour on this blog page. Note: my coding skills are young and fresh with much to be learnt so basic coloured headings and some font change is all I could achieve for this week.

A Plot.ly Graph

1901 Census: Population of South Australia (except Adelaide)


Week 3 – Do we need a Filter Bubble?

The Filter Bubble is a very interesting observation regarding search engines. I don’t think bias will ever be eradicated whether it’s a search engine based on Internet usage, a library catalogue or anything else in the real world. A search for ‘unprofessional hairstyles vs ‘professional hairstyles’ does not depict a racist search engine but rather 1. The type of people using the web, 2. Their interpretation of what professional means and as a results 3. What a professional hairstyle looks like.

I also do not think bias needs to be eradicated. Many of us choose to live in a ‘bubble’ of some description and that is okay. When it comes to search engines we also need to live a bubble on some level. When I search for a restaurant, I don’t want to know what restaurants are in another country. I want to know what restaurants are available in the city I am in.

Our bubble helps protect us from paths and places that we are just not ready yet to see or deal with and that is okay too. When it comes to search engine bubbles I feel that if you want your search engine to start showing you other perspectives then you need to actively go out into the World Wide Web and search for those other perspectives first. It lets the search engine know that you are open minded enough to accept and question what those other perspectives are.

This also goes for the saving, displaying, conserving etc. of cultural heritage collections that society/ or whom ever simply is not yet ready to deal with for whatever reason. It is okay to leave things for another generation or someone else to deal with. Someone better equipped, more knowledgeable and practiced within an area will handle that information and object of a particular culture better then someone who has to deal with it simply because it showed up on their desk or with in their search results. Our personal judgment is there to protect use, the individual from that, which we are not yet equipped to handle.

This is not to say that search engines are perfect and can not be improved. Creating conversation around how search engines work points our attention to the need for search engines to evolve in some way. Perhaps search engines shelter people a little too much and it is time to widen the bubble just a bit. I certainly do not feel it is time to let the flood gates wide open but some refinement may be in order.


Week 2 Reflection

It is the beginning of week 5 and as I received my log in details last Thursday I am using today to catch up on my reflections from the previous weeks. The blog post required for week 2 was our introduction however some people have posted a reflection so I am just going to go with a reflection also.

My reflection is based on the readings from Foster, Robertson and Sherratt. Firstly I think that Museum Selfie Day is a fantastic idea. The World Wide Web should be interacting with museums and museums should be interacting with the World Wide Web. When I first started this degree I completed a project teaching the hand written method for cataloguing museum and library objects. Clearly the presentation and documentation of historical objects is outdated as the world shifts to online resources. What better way to make history interactive, then to bring it to online mediums. I say, “If the people won’t come to the museums, bring the museums to the people.”

I did not understand most of Robertson article as I found this article difficult to read and I do not fully understand all this entire digital world ‘stuff’ in depth. However, the idea of hacking to discover what we are not allowed to know or to better present what is available in a more readable form had me thinking about history, Australian history and the way it has been taught to me up until this point.

Last week I went on a excursion (for another class I am studying this semester) to the National Museum of Australian (NMA) to explore the aboriginal displays, where we had to think about the way they were displayed and the way the displays spoke to the viewer. My overall impression from these displays was the effect white mans intrusion had on aboriginal communities, how these communities felt about the intrusion and a sense that aboriginal communities were reclaiming their identity by sharing their artwork and cultural traditions. Which brings me back to what I have learnt about history in school and the wider outside world. Most of the history I have learnt has been based on a white Anglo-Saxon background and as I think about it, surely other cultures have had a substantial influence on Australian history yet it is not heavily weighted in the teaching of Australian people. Would our history look different and therefore the formation of this country in particular be different, if history was documented without hidden agendas.

Perhaps as the online community for history grows, a more real world representation of history will be gained as opposed to the somewhat suppressed history that seems to be present.


Week 4 Reflection_Yizhuo Zhang u3125186

In week 4, I explored how to deal with data.

I understand how to use Plot.ly to creating a chart to presenting data. It’s quite easy to use, just like Excel, and I can share the chart online. But I found a problem, that is, when we use bar chart to visualise the SA census data, the Adelaide is too high, so we just delete Adelaide in the chart, but I think it’s not the best solution. Or maybe we shouldn’t use bar chart. I’m still seeking the solution to deal with similar situation.

I’m considering to use Plot.ly and other tool to make a project about history event, Tian’anmen 1989.

Then I explored some states government data website, I found some interesting data, like vineyards census in SA, Cattle tick zones in QLD, VicRoads Turning Movement Volume Surveys in VIC.

They are really convenient to access. But in China it is impossible, data is the secret of government, they rarely publish useful data, even people don’t think those can defined as “secret”. And for my project, I think I can’t find useful data from Chinese government website, because the topic is too sensitive.

I also found WTHCSV is quite interesting, you can see the “most” of a set of data. Like the most family name in SA. I will consider to use this in my project.

I think import.io is also very useful, it makes me away from heavy work. The most useful point is you can use it to extract a list from web, like parliament MP list.

I’m sorry I can’t use API to deal with data, but maybe I will be more skilled in the future.

Cheers,

Yizhuo Zhang

Thoughts on Week 4

One of the problems that I have always had issues with in data mining exercises, or even just finding the right articles to read for an assignment is the proliferation of alternative spelling or terms for the same things, eg pot vs jar in ceramics. It was interesting this week to be introduced to tools that begin to consider intelligent work arounds for this, although I think even know I would be more comfortable looking through the returned data myself it will definitely streamline the process.

One of the up-sides of working with a digital, or digitised, data set is that it is faster to analyse the information hidden in the numbers and subsequently manipulate the results into a visual format for ease of discussion.

Week 4 Reflection.

Hey everyone!

I felt like I needed a bit more time than usual to understand this week’s readings and activities because this area is very foreign to me, but thats what uni is for! Introducing us to new ideas and tools. I played around with making my own graph, which was cool and got me thinking about my project and how I will approach it. It is still early days though so my ideas are very small.


I’ve never really thought about data in this way, or considered how HUGE the internet is until this unit; for example I never considered the fact that in a museum or gallery you have a limited amount of storage space for a collection, however online there is no limit.

That’s all from me this week, I’m still trying to process a lot of the new information so hopefully next week I’ll be able to have a more detailed reflection 🙂

Nour.

Week 4 reflection

This week we focused on looking at ways which we can retrieve data from online for our projects. Looking at a number of different sites and ways that we can create graphs using that data also. It was really interesting to see  number of different ways to display the data so it was easier to read for the viewer and also for yourself so you could find out little pieces of information from within that and use it in researching. It was also good to learn a number of ways that data can be retrieved it would be very useful to know that for my project, I also found it interesting that it was so simple to retrieve the data from a website like we did with the house of representatives during class, especially knowing that you can not only get the information but an image which will then link up to that persons page, certainly something that would be useful.

css.php