Project Reflection

  • A brief summary of your project and its aims

My project is titled “Life During War”. The idea behind the project is based on the realisation that we are fortunate enough to have people who lived through wars in the 20th Century, and that we will soon lose everyone that was alive during World War 2. This means that kids that are currently in their early years of primary school are highly unlikely to have the opportunity to have a WW2 survivor stand in front of them and tell them their story – which I was lucky enough to experience.

  • A discussion of what you learned through the project. What went well? What difficulties did you have?

There were several issues and difficulties along the way with both creating the data set and in its presentation.

Firstly, it took me a few weeks to come up with an idea that was viable. The weeks I lost trying to find an idea meant that I felt stressed and concerned that I had already fallen behind. However, I did eventually come up with an idea and finished it as best as I could in the time given.

To create the data set I would use in my project, I had to edit the video footage of the interview – something I had absolutely no experience with. There were a lot of moments where I thought I had completely stuffed things up, accidentally deleted things for good, or second-guessed my editing decisions.

It was during the editing process that I discovered that in the middle of John saying something, the camera loses focus and then refocuses – all of this is audible on the video. This is unfortunate, but it is in the middle of a story and I didn’t want to cut the whole story out. Thus, it has been left in.

Due to time constraints, I had to use Omeka for my project. Since I had only used it once before and that was a year ago, I had to re-acquaint myself with it. This took a lot of trial and error and also asking for help. With Omeka, I didn’t have the freedom to create the visual layout that I had imagined, so I had to stop and think through how I could achieve the type of layout I wanted using the tools available to me on Omeka. The layout journey led me into multiple formatting issues, which I have solved as best as I can.

I went in to this with the thought that with Australia being part of the Commonwealth, the National Library’s Trove site would have a lot of newspaper articles for me to choose from. Instead I discovered that Trove has a lot of entries about rationing in Michigan, Detroit, and the occasional British entry. I also discovered that Australia’s online newspaper archive is better than Britain’s, especially since you don’t need to use credits to open an article in Trove.

When I thought about putting the elements of my project together, I had thought that embedding would come back to me just like that. I was very wrong. The only thing I didn’t have any issues with was finding the embedding inks for Youtube videos and Google My Maps.

Though many things didn’t quite go to plan or were difficult, there were some good things about it.

I believe that my project lives up to its aim and I look forward to a student learning from it, or at least finding it interesting.

I am thankful that my finding people to interview was a lot easier than I thought it would be. I was lucky that my mother’s old boss and his wife – who are close family friends – were children in England during World War 2, which fitted very nicely with my project idea. A bonus was that they are very interesting people and were happy for me to interview and film them.

  • Your assessment of how successful the project is in meeting your original aims.

Because I ended up using Omeka, I didn’t have as much freedom with the layout as I originally hoped to have in order to create what I had pictured in my mind. As such, the project hasn’t been 100% successful in meeting my original design and layout aims.

However, I feel that the aim in doing this project in the first place has been met – I have recorded and told the experiences of two people who grew up during World War 2. I believe that I have succeeded in this, and now when my nieces and nephews are old enough to learn about the war, I will be able to show them the stories of real people who were there so that they can hear first-hand accounts, like I have, and see the lifelong effects of war so that they will grow up with empathy in their hearts and a dislike of war – what more could an Aunt ask for.

I aimed for this project to be used by high school students. And although the design isn’t ideal, I believe it serves its purpose and has a user-friendly interface which should allow any student to use it.


  • Some thoughts on how the project might be extended. Did you have ideas you weren’t able to pursue?

The current premise of the project is to document the experiences of growing up during war. This could be extended to cover anyone alive during that war, such as asking someone what it was like being sitting at home watching a horrific war take place that could have devastating effects on the entire world knowing there was not much that they could do about it.

The name of the project, “Life During War”, is specifically named not to specify one particular war, and is instead more general. The vague nature of the name allows it to be used for any war. If I had the opportunity, I would like to extend the project to cover the major wars that followed World War Two. I would ideally cover the wars in chronological order, starting with the Korean War and then the Vietnam War. With the Vietnam War, I could potentially interview my Dad about what it was like to see your best mate go off to fight in a war because of conscription.
project reflection

My project consisted on creating a website, which I named Plays&Players with three types of collections:

  1. Plays (from Greek theatre to now)
  2. Songs (different genre mp3 audios and they corresponding lyrics)
  3. Dancing styles (ballet, traditional Japanese dancing, hip hop, rock, and so on).

The aim, was to use SameDiff and WordCounter to search the similarities and differences between the items of the different collections. For example:

Jane has a song she would love to sing in a concert or musical play, but she does not know if there is a play or script that would fit the lyrics of the song. Therefore, she goes to the script collection and browses through the different genres. Once she finds the style she likes, selects the script and compares it with her song lyrics in SameDiff; where she finds out instantly if the script and the song are compatible.

Furthermore, the website is intended to provide Actors and directors (amateurs and experienced) with:

  1. a quick browsing trough acting styles
  2. a fast way to find a play to perform
  3. an inspirational site to start creating your own plays.
  4. a site to relate to other people that share your interests and, maybe, want to pair with you to create a project together.

LEARNING OUTCOMES:

One of the main things that I learned through this project was to be realistic towards what I can achieve with my skills and the time I have to develop a project. Although is a prototype of what it should rely be, I was expecting to be able to incorporate much more content and tools.

I thought that time was something I should look after when choosing a restoration or conservation treatment for an object. But now, I realize that this terms also apply when you decide to create a digital collection.

While building the website, lots of building actions where repetitive. Due to it, I was able to comprehend, and use embedded codes and tools (that where in the website and the ones provided in class), that  I could not understand entirely before. Moreover, I was able to understand my own work better.

Accomplishments: 

  • the design of the website worked better than expected. I was afraid to create a project out of omeka (which is the only site where I built a collection). But,  taking that chance made it fun and I gave me the possibility to develop the appealing visual design that I was looking for.
  • I was able to embed webs and codes, music and videos; despite the time it took me to have this done.
  • The way in which I structured the collections was exactly as it was in my mind.
  • I wanted to have a ‘visit counter’ only for the manager to see, which I succeeded on using an application that I found within the website’s tools.
  • Adding Testimonies and News to the site was an idea that came while I was already building the project. As I was not going to be able to develop a blog or chat room for people to interact with one another, I decided this where good additions, which where:  (1) easier to create or add, (2) a way to keep people connected to other people and let them know what is going on in their field of interests.

complications

  • I wanted to use SameDiff and Wordcounter as tools that one could use in the website; yet I had to create a direct link to them, due that those tools have their own web to function.
  • Because of the complications with the tools mentioned in the previous point, I had to think of another tool to use in my website. Therefore, I decided to go with  Voyant.  I was not going to be able to compare texts within my site, but at least people would be able to see in a word diagram, the words that were used the most within the text; giving them a clue of the main theme of the item.
  •  It was quite hard to build the site. I never imagine that It was going to take me so long. Moreover, I had to learn how the website builder worked and spend hours trying to choose a theme for my page. At first I was overwhelm by the amount of tools I had to build the site, but the more I worked in it, help me get the hand of it.
  • I also wanted to add an extra language to the site, so people from different countries could participate. But, I did not make it on time.

original aim success

I would say that only have of the original aim of the project succeeded.

I would like to keep an eye on it during a couple of months. Just to see peoples reaction to it. Hans, the fact that I achieved only half of the project, does not mean that people do not find it useful the way it is now. Yet, there is always place for improvement.

I believe, that if I had three to four more weeks I could have achieved much more. I’m satisfy with some aspects of my project and discontent about the goals I was not able to achieve. But is always good to stick to the learning outcomes of it.

‘One learns more from mistakes than from doing things the right way’.


extension of project

The project could defensively be extended by:

  1. Incorporating more items to each collection
  2. incorporating more information about the items in each collection
  3. creating a blog where the people that are subscribe to the website can chat and expose their ideas, relate to one another and create group projects.
  4. It can even be a web with extensions all over the world to help theatrical institutions and self-tough individuals to develop their skills.


Week 6 Reflection

Week 6’s workshop focused on the different ways to visualise data. I found it particularly useful in terms of my assignment and it gave me a few ideas of how I would want to assess the data that will be displayed on my website.

This week we were asked to examine a few different types of websites that create data visualisations in different ways and consider some questions. My favourite of the ones we were asked to look at was ‘The Preservation of favoured traces’ website which visually demonstrates the expansion that Charles Darwin’s ‘Origin of the Species’ throughout its various editions. While the visualisation was less useful for knowing exactly what was being added (especially as you could only see what was being added if you hovered over the different sections) it gave a really good overview of where sections were added and expanded upon as the science behind it developed.

This was also the week I was introduced to Silk which I went on to eventually use as my website host. And made me think about how I wanted to display the data. The various examples that were used this week helped me to make some decisions in terms of what I wanted to use. I was given a lot of food for thought this week as it forced me to think about the aims of my final assignment and about what I wanted to achieve.


Patience’s Final Project Reflection

The website I created for this final assignment is called ‘Artvisitr’ . The aim for the created website is to provide an alternate way of interpreting data included in The Art Newspaper‘s annual publication on most visited Museum and Art Exhibitions. My primary goal is to increase comprehension of the trends and visitor numbers that may be present from year to year. I hoped to do this by displaying the information in a variety of different ways including mapping the exhibitions by location and venue, as well as a break down of the most popular terms used in exhibition names for each year. Through doing these analyses for each block of data I hoped to expose trends in attendance as well as popular topics for exhibitions and so give insight into the world of cultural tourism.

I hope that the information contained and displayed on my website could be useful to industry professionals such as Art Curators and Exhibition Designers in terms of choosing topics for potential exhibitions. The information contained on this website could also be a useful teaching tool for University lecturers and students alike as it allows for the information to be interpreted as needed.

I feel like my project succeeded in its aims despite only being a sample of what I could potentially expand on. Through the analysis of Museum and Exhibition attendance over a number of years I was able to visually see the change in daily museum attendance, and how the visitor numbers were clustered. An interesting fact is that you can see visits to the cultural institutions went down in about 2010 which was in the middle of the last ‘Global Financial Crisis’. As a part of the most common terms breakdown, you can see that the words ‘impressionism’ and ‘Picasso’ appear a number of times in different years suggesting perhaps that there has been a resurgence of interest in the works of Picasso, and also in the style of impressionism.

I found this project relatively straightforward once I was able to decide on a topic, however technical issues proved, and continue proving, to be the most difficult part of the assignment. I used a variety of tools to create my assignment but the first and arguably the most important part was the conversion of my PDFs into Microsoft Excel files so that I would be able to import the files into my tools. In my original proposal I said I would use a built in file convertor that would adapt the tables of information I was using to a more versatile format. I found in practice that the PDF convertor was unreliable and so in the end I resorted to manually writing up the information myself. While this does potentially introduce more errors, it was simpler to do this manually than to go through a computer program. Also a choice I made in the creation of this assignment was to limit myself to the Top 100 results as I have been working on other assignments at the same time. It also meant that the website could serve as a sample of what it could be rather than a completely finished project.

I then used OpenRefine to clean up my data, but it was particularly useful for fixing errors in city and venue names. After looking at a variety of hosting websites I decided on using the website host Silk since it seemed to apply to most of my needs. This was mainly because the website has a large variety of built in options to display data in different ways. Options that I made particular use of included the scatter plot, as well as the ability to place the different venues on the world map and then size the points by number of daily visitors attended. I ended up using Voyant to make the word-clouds but since I was unable to work out how to properly embed the interactive graphs into Silk I had to save them as a PNG and manually import them into the website pages.

Unfortunately Silk has proven to be buggy in a variety of ways. When originally importing my data packs into Silk, on multiple occasions I had to continually re-upload my data files to get them to display correctly on the website and allow me to use all 100 of my points for each year. Another problem I have been having is that my imported word-clouds are not displaying correctly on the public versions of my web pages. When I log in and use the website editor everything looks fine. However this problem currently seems to only be affecting my own laptop as the word clouds display correctly when I visit the website on my phone.

In creating this project I also had some technical issues with the use of Voyant where word-clouds would fail to correctly display the most popular words in the data group. To combat this I had to re-upload the text to be analysed until the correct words appeared in the word-cloud. I do not regret using any of the tools I have used for this project but feel like there is opportunities for improvement in many of the tools I have used.

I feel like I have succeeded in my aims but there remains plenty of options for expansion in the future. For this assignment I only analysed the published results for the years 2009, 2010, 2011, 2013,2014, and 2015. However the summary has been annually published since the mid 90’s so there remains plenty of opportunities to expand, not to mention the fact that the summary is published yearly so there could be some future work in keeping the website current and up to date. . Another way I could possibly expand the website is to publish the total results for each year instead of only the Top 100 figures as this would provide an even more expansive view of the trends in cultural tourism and exhibition topics.

Another feature I might like to add in future is the opportunities for visitor feedback, in terms of a comment or suggestion section that allows for people to request different versions of the data. That being said, Silk already allows visitors to change how the information is viewed using the ‘explore’ tool.

To conclude, I really enjoyed working on this assignment despite all the frustrations involved with the technical side of things. It was really fascinating to see how the trends have changed in just a few years with such a small sample size. The potential for this website is huge, but only time will tell if I choose to expand on this project.

Week 6 reflection

So I’ve just gotten up to date with the week 6 lesson 🙂

I thought this lesson was interesting; I never considered the fact that there are so many types of graphs! Unfortunately I couldn’t make any graphs because my laptop doesn’t know how to do normal laptop things.

Mapping Police Violence was so confronting. Just seeing the number up the top, and then being able click one of the markers to read about the victims, and then seeing the visual list of how many officers got away with their crimes. I couldn’t get off the website for awhile because there is just so much information in it, and it is so straight forward, in your face, easy to read facts.

I had a look at some of the others but that one was definitely the one I considered to have the most impact.

I enjoyed this lesson because I started off thinking it wasn’t within my interest range but then I genuinely enjoyed the content and all the external websites and links.

Thanks 🙂


Project Reflection

Summary of my project and its aims

My original project intended to add extra dimension to a website that I designed and continue to maintain to promote Jane Austen Festival Australia, an annual event that I organise to foster the learning of dance, sewing, theatre, writing, fencing, period games, and more during the life of Jane Austen. In this project I wanted to take my love of learning across to the website and turn it into an educational resource. The original intention was to feature a collection of antique objects that is going on display in 2017 and that I’ve been cataloguing on an Omeka.net collection website. Each item in this collection was going to be used as a conservation resource with 3D and zoomable pictures showing areas in need of conserving and how to conserve them, patterns to make a copy of the object, links to suppliers and recommended reading, and so on. I owned all the items, so there was no issue of copyright to worry about.

What I learnt, what went well and what difficulties did I have?

Suffice to say, I realised the project was just too ambitious to fit in amongst a full-time 5-unit semester load, and it has been put on hold. I found out early on that my IT skills are lacking in the 3D department and I have a lot more to do before I share my attempts on a public forum.

I still retained my interest in developing the festival website and had a sudden last-minute brainwave that Tim didn’t think was too crazy. I started this annual event from scratch in 2008 and have been the sole administrator and still have all my attendance records and ticket sale data. Why not play with this data and get a better picture of how the festival was going? It was easier said than done though, as after getting all the data into lots of pretty charts and tables I realised the most important issue of all – privacy. My .csv files contained personal names, addresses and telephone numbers and even though I applied filters when preparing the tables and pie charts, in some formats the end results showed up information that I had filtered out. It was not safe to have any unknowns with private data so I had to start it all again and clean up my data.

Playing with the data was fun, though I found the examples I produced in RAW very pretty but not suitable for what I had in mind.

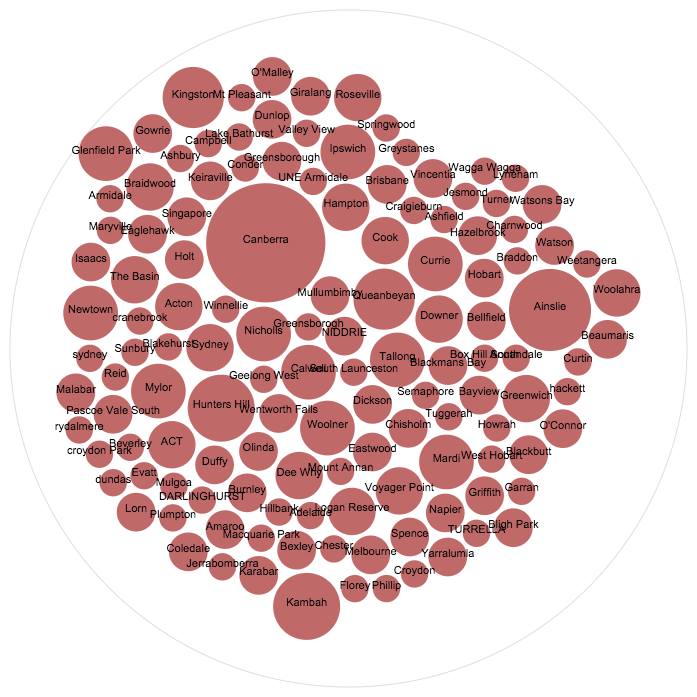
An example of RAW data
An example of RAW data produced at http://raw.densitydesign.org . Gardiner-Garden, 2016.

Google Fusion Tables ended up satisfying most of my needs, however not everything went smoothly. The first sign of trouble came when I tried to geocode my data so I could place all the attendees on a map. In order to produce mailing labels for attendees I had set up my original spreadsheet with city, state and postcode in separate columns. For geocoding to work all this information had to be combined in one column. Off I went to get the Merge Values add-on for Google Sheets. Without this add-on a merge of three cells would result in a merge with only the left cell’s contents remaining.

One adventure was not enough for me. I spent a while getting an API key and installing the Powerhouse Museum Plugin only to find out it wasn’t displaying the objects how I’d anticipated, even though I put in the correct html.
[phm-grid cols=4 rows=4 v_space=1 h_space=1 thumb_width=240 thumb_height=240 random=true parameters=”title:chair|description:New South Wales”]
I will have to see if I can get API to work instead, but that is another large project to go on my to-do list. My html problems with the WordPress plugin may have been because the plugin is two years old and no longer supported or it could be because I had an incompatible wordpress site. I think its a bit of both. My Powerhouse Museum test page that is not on obvious display to the public can be seen at http://janeaustenfestival.com/costume/. Please note, the page contains written information that is not supposed to be there.

And on to an even bigger adventure that has halted work for now. I installed the Moove plugin to track user activity on the website to see if the new additions brought in a larger audience. Moove looks very useful as it tracks date/time, user name, activity (visited/updated), client IP, client location (by IP Address) and referrer url of visitors to the website. Sadly this installation has resulted in a white screen of death on the admin side, and I will now have to log in with an ftp server to find the offending plugin and delete it. I’m still keen to see if this plugin will work, as it also works with a membership plugin.

How successful the project was in meeting your original aims

I’m pretty happy with most of what I have done so far at http://janeaustenfestival.com/about/history/ but do note it is not finished because I am currently locked out of the website admin and have more charts and tables waiting to be added. By analysing this data I’m getting a better picture of how my event is growing. The audience is increasing every year, and for a Jane Austen event it was nice to see that each year we seem to get more men. Its early days yet, but maybe with the publication of data that shows our most popular age group is 25 we might get a few more men along?

Some thoughts on how the project might be extended. Did you have ideas you weren’t able to pursue?

This project will be ongoing. I’m keen to get the Powerhouse Museum Application Programming Interface (API) working so that people can view items of this period from the Powerhouse Museum collection. And once I’ve recovered from my first semester of study for over 23 years I’m going to get the original collection idea moving! I’ve already had people volunteer their interest from around the world in helping so it might be quite soon. Crowdsourcing for help gives you a great sense of well-being as you find there are so many others out in the world interested in what you do and keen to help you get it done.

Week 12

Amazing! Today’s workshop was my very last class as an undergraduate… I hope!
It is interesting to consider that my first lesson was a classic anthropology lecture delivered by the legendary Brian Egloff. Things have really changed. In 2006, most museums had a website but engaging audiences digitally was a low priority. Today digital engagement is increasingly an essential way for cultural institutions to do business, so it seems fitting that my last undergrad class is Exploring Digital Heritage… Thanks Tim!

To begin with today, it was fun to seemingly hack ASIO – the black car that has been tailing me since is a bit scary! But all good.

I was surprised to hear that the redactions that Tim has been working on were created, not by an ASIO agent lurking in a dark alley, but at the Archives in a locked room by someone with a Top Secret security clearance. I am endlessly surprised by the variety of jobs in the GLAM sector.

The Head of the Library of Congress is a lifetime appointment – now that is amazing job security… The Thomas Padilla section of the library of congress’s symposium, “Collections as Data”, provides a great overview of the imperative to digitise collections, balancing this with an outline of the related challenges. Padilla refers to the digitised version of an artefact or book as a surrogate, further he says that each surrogate brings its own opportunity to make connections or to seat the artefact in a community. This is a very succinct way to describe the benefits of digitisation. I also identified with one of the concerns highlighted by Padilla – that viewing collections as data risks reducing lived experience to the equivalent of butterflies pinned in a cabinet of curiosities.

Allowing access to heritage collections online may appear a no brainer, but it is met with organisations grappling with moral rights and copyright. Is it really ok to say to the public, to quote Padilla, “Right assessment is your responsibility”.

Week 2: Doing it in Public

Sorry for this very random and out of place blog post regarding Week 2. I was worried that I did not have 8 posts so thought I would write about this week’s topic as well because it was one that really stood out for me so I was surprised I had not reflected on it ! (Who knows what I was doing instead!) 

Heritage, museums, and digital heritage to me is all about the public, there would be none of it without an audience. Trove Traces really highlighted this, that whilst everything might be about the audience and the public – we have really no control of how they may engage with digital data/representations, how they will feel about it or take away from it. It is completely unexpected, and therefore makes the digital world constantly changeable and different to every person that works through it. I saw this in the class as well with how different people reacted to things differently, and the different types of projects we all came up with.

I really loved the crowdsourcing projects, and will admit I spent quite a well on the Measuring the ANZAC’s at home. I liked it because it wasn’t an assignment, there was no pressure for me to do however many however fast. It was so interesting to actually engage with the documents and make a small difference in their research and context. It lets you be apart of the history, and shows how much work there is to constantly do in this field!

Week 11

This was an interesting lesson. I am not sure why, but I am left with more questions than answers…

DIY web archiving

I really like the idea of playing arcade games from the 70’s and 80’s – so simple and quirky. As a teenager, access to arcade games was limited because it involved getting 20 cents out of our parents to waste in a machine! I was also so bad at playing, that the whole experience lasted about two minutes. These games and the movies are great examples of why we collect stuff. To evoke memories… and …wow 12 year old me is jumping for joy (I can play these games as much as I like for free!).

Here is what I do not understand …. Some of THE METs http://www.metmuseum.org/ collection is also posted in this archive. Why is this the case? THE MET has a perfectly good collection search portal that is not going anywhere. In this archive, you can collate similar objects together such as embroidery samplers from a range of institutions. However, if these records are changed or improved at their primary source, this is not reflected on this site. In contrast, check out THE METS Pinterest pages, it’s based on a live link so you at least know you have the latest info on any one thing. Additionally, you can make your own boards that consist of material from a variety of institutions. I can see that archiving is useful when a museum, for example, closes – but why archive material from sites that are alive and kicking, growing and changing?

On one of the blogs provided as part of this lesson, I read that most web pages have a life of only 100 days. I can see the point of archiving some pages and material released to the web. However, there are mountains and mountains of content released every day – how do we decide what to keep? It sounds great to keep everything, but we have already learnt that it is difficult to see the forest for the trees, or through the filter, as the case may be. Everything that is kept has a cost, even if it is digital – storage and back-ups need someone to manage the material. There needs to be a selection process. We need to be able to identify material that is unique and will disappear without attention and keep enough to paint a full picture but no more. Even Noah saved only a male and a female of every animal type, not five of everything…

Week 10

Week 10 – AR VR and 3D

This was a fun lesson…

I enjoyed exploring 123 catch. The 3d model of the Tardis was good as long as you do not look at the back. I can imagine playing with my kids and getting a bit obsessed with trying to render perfect models. I also think that this could be a great Public program at the museum. Kids could select something from the education handling collection and go about creating a 3D likeness… Speaking of kids what about free 3D colouring… http://www.quivervision.com/

Tim, like you I wonder about the application of AR and VR for Museums. The NMA has developed an AR trail relating to Kspace. You download an App, then look for markers throughout the museum, and are rewarded with a Kspace character when you aim your device at the marker. You can also download the markers and use the app at home – though, the site does not say much about using them at home. But in thinking about it now, maybe a game of hide and seek or a scavenger hunt would be cool! On the flip side, I’m not sure how this contributes to the museum’s mission. http://www.nma.gov.au/kspace/kspace_app.

I too find most of the cultural institutions on Google Institute a bit disembodied and lifeless. It is kind of fun that you can visit lots of institutions at any time of the day, in any part of the world, but what do we get out of this? Here is the Ted talk by Google’s Amit Sood, explaining the development and thinking around Google institute; https://www.ted.com/talks/amit_sood_building_a_museum_of_museums_on_the_web?language=en

While I am not that keen on visiting the cultural institutions via Google Institute, I really do think that being able to explore historic sites it useful. For sites such as Pompeii, or the pyramids of Giza, the technology used by Google institute allows detailed recording. Additionally, everyone can visit fragile sites without causing further degradation. Opportunity to visit such sites is a bit limited at present, I would like to see more. It would be great if these kind of sites were able to give google more access, allowing visitors to go behind the scenes and explore in more detail.
Lastly, I am not that keen on the idea of 3D printing artefacts, except in terms of giving access to people with visual impairment. Touching replicas and examples of materials from which the original object was made can aid in accurately imagining an artefact.

Perhaps for cultural institutions it’s all about horses for courses… Looking at where this kind of technology is appropriate or useful to adding extra layers of interesting interpretation.

css.php