Reflections for Week 11

This week I have the final images and stories ready for uploading to the website, once done I’ll then start the process of testing all the links and making sure it all works, it has run live now for about a week.

Our class notes this week have us looking at archiving tools available to use to archive collections, digital records, files or just about anything found useful on the web. From a Commonwealth perspective, there are a few systems available for digitising available from the Australian Government web archive http://webarchive.nla.gov.au/gov/ and Pandora http://pandora.nla.gov.au/ to some smaller projects like the National Archives of Australia digitisation project for digitising it’s paper archive http://www.naa.gov.au/records-management/agency/create-capture-describe/physical-records/index.aspx .

Whilst a fully functional digital archive is a great tool, they are expensive to operate and maintain with any use they provide being that of providing the intangible support to the tangible objects that nay still exist in the collection.

Digital archiving is here to stay, its success will depend on its flexibility and capability to support the cultural displays or records management programs in the future.

Reflections for Week 10

Reflections for Week 10

My project is coming along having received an actual domain name (url), images and works being positioned suitable for both PC and Mobile device viewing and even with my very limited experience, it is starting to look good.

This week we looked at digital heritage through the realm of virtual reality, augmented reality, 3d imaging and 3d printing and was another great lesson in the use of technology  for the betterment of cultural heritage (though my attempts to recreate a 3D version of an old school bell resulted in something more akin to works by Salvadore Dali).

In areas like Iraq and Syria, this  technology is currently being used to document as many culturally significant objects, artefacts, landmarks and museums before the are lost forever due to war and acts of wilful destruction by extremist groups. These projects are described in greater detail on the internet through sites such as UNESCO, and there is a great article http://theconversation.com/preservationists-race-to-capture-cultural-monuments-with-3d-images-53536 ,  on the race to capture and preserve as much of this significant cultural heritage before it is destroyed by the IS extremist group.

Regarding future accessibility, it is a great digital program to record these sites in the greatest detail possible before they are lost forever. From a “Joe Public” view these collections will then have the capability to be made into exhibits for those who may not have the physical ability,  time, finances or simply just live too far away to now experience museums that they may have an interest in personally or professionally.

Reflections for Week 9

After some initial panic and a few hours of further study on website development courtesy of Lynda.com, my website is starting to come together, chalking this one as another successful week.

This week the lectures had us looking at new technology that would benefit the field of cultural heritage (and our lecturers continual attempts at poking the bear- ASIO…seriously he won’t be at class one day because a couple black vans have double-bagged him and carted him over to the Ben Chifley Building for a …. discussion about the true purpose of redaction).

We looked at facial recognition technology with several different facial recognition systems considered, all being able to match a face with a database of faces to find its owner including facial detection where a computer scans an image and finds the basic features of a face within.

objects-that-looks-like-faces-the-mop-face

If technology is going to keep growing in use and advances as it has (and will) then people just need to understand that early attempts of large-scale facial recognition (such as projects undertaken by Google and Facebook to link every face on its system with a name) will not always produce correct results and may even get it very wrong. Looking to more dedicated professional, commercial grade facial recognition systems, often incorporate retinal detection, thermal imagery and other features of the person to confirm a match.

The future is here; it is used in airports and casinos daily to target “persons of interest” and with advances in camera and digitising technology the accuracy is improving at a rapid rate.

Reflections for Week 7

Reflections for WEEK 7

This is it my project plan is complete and submitted (even though I left out a whole section I prepared on analytics and the use of Google Analytics as a tool to track website attendance).

This week’s class information I enjoyed looking at the many different uses for maps and the variety in the quality of cartography used to produce maps we use every day. One of the highlights of this week’s lesson data included the geo-rectifying of a map of 1865 Melbourne.

I also thought the process of geo-rectifying historical maps was very clever, we were introduced to this type of cartography during the Cultural Heritage Field School as a tool to verify spots of cultural heritage interest.

Reflections for Week 6

This was another busy week, approval to use images vital for the completion of my project were received this week and while it does not affect my ability to complete the initial plan it does have an effect on the final project.

This week we looked at data visualisation and some of the tools available that can be used in a digital heritage context. Using Plot.ly for creating graphs I created a stacked and group bar chart showing attendance at cultural institutions by gender (2013-14).

attendance-at-cultural-institutions-by-gender-2013-2014

It tells a story about categorical data such as institution type, traffic volume and visitor gender but to be useful the graphs also need to show why and how they achieved the attendance numbers (general visitors, special event, new movie release, etc.).

In support of creating graphs that tell a story, two of the site I found that did this quite well were the Timeline of Earth’s Average Temperature and Mapping Police Violence.  Both are aided further by graphs, charts, and other visualisations of data and both left you with a feeling that a story was told, though the further research into the why and how were still needed.

In conclusion, every graphic should be able to explain the data simply and in a way that a common answer or theory is visualised regardless of who reads it.

Reflections for Week 5

This was an interesting week, the subject of differing types of analyses appealed to my normal drive for solving complex problems (both at work and in class!). My project has life and apart from any setback with receiving the necessary approvals to use some information (even though it is freely available on the internet), all is currently looking good.

Research in/and on the subject of Commonwealth Policing has its limitations (i.e. Commonwealth Police were transferred to the new Australian Federal Police in 1979) any searches for historical information on this topic from 1979 will require the addition of both Commonwealth and Australian Federal police to yield the best results.

ngram-afp

Using Google Ngram it confirmed my search for books relating to either Commonwealth Police or Australian Federal Police had to be further defined or risk my final project looking cluttered and difficult to navigate.

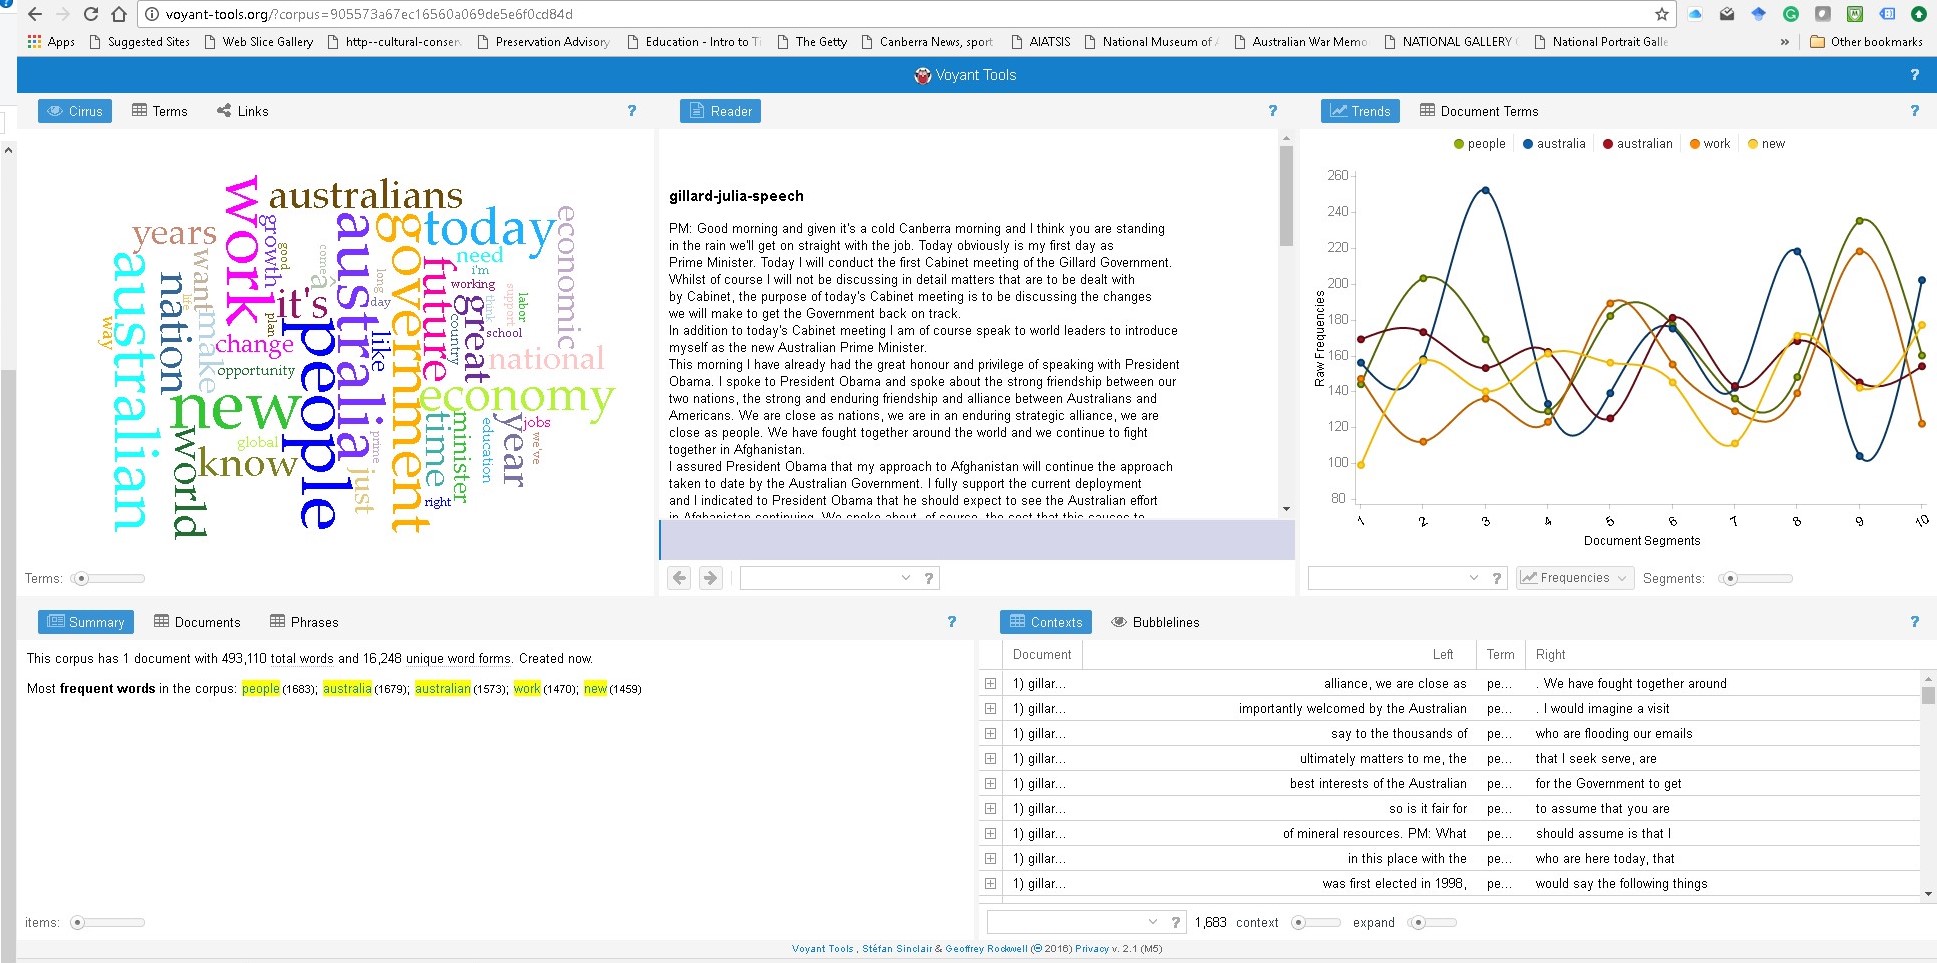
Back to the day’s lessons Voyant and Wordcounter offered some fun and is a great tool to run your own speeches or class presentations, using the outcomes as a guide for better speechwriting (no one likes to hear the word UMMM!)

voyant-julia-gillards-speach

Voyant Tools – Julia Gillard Speech

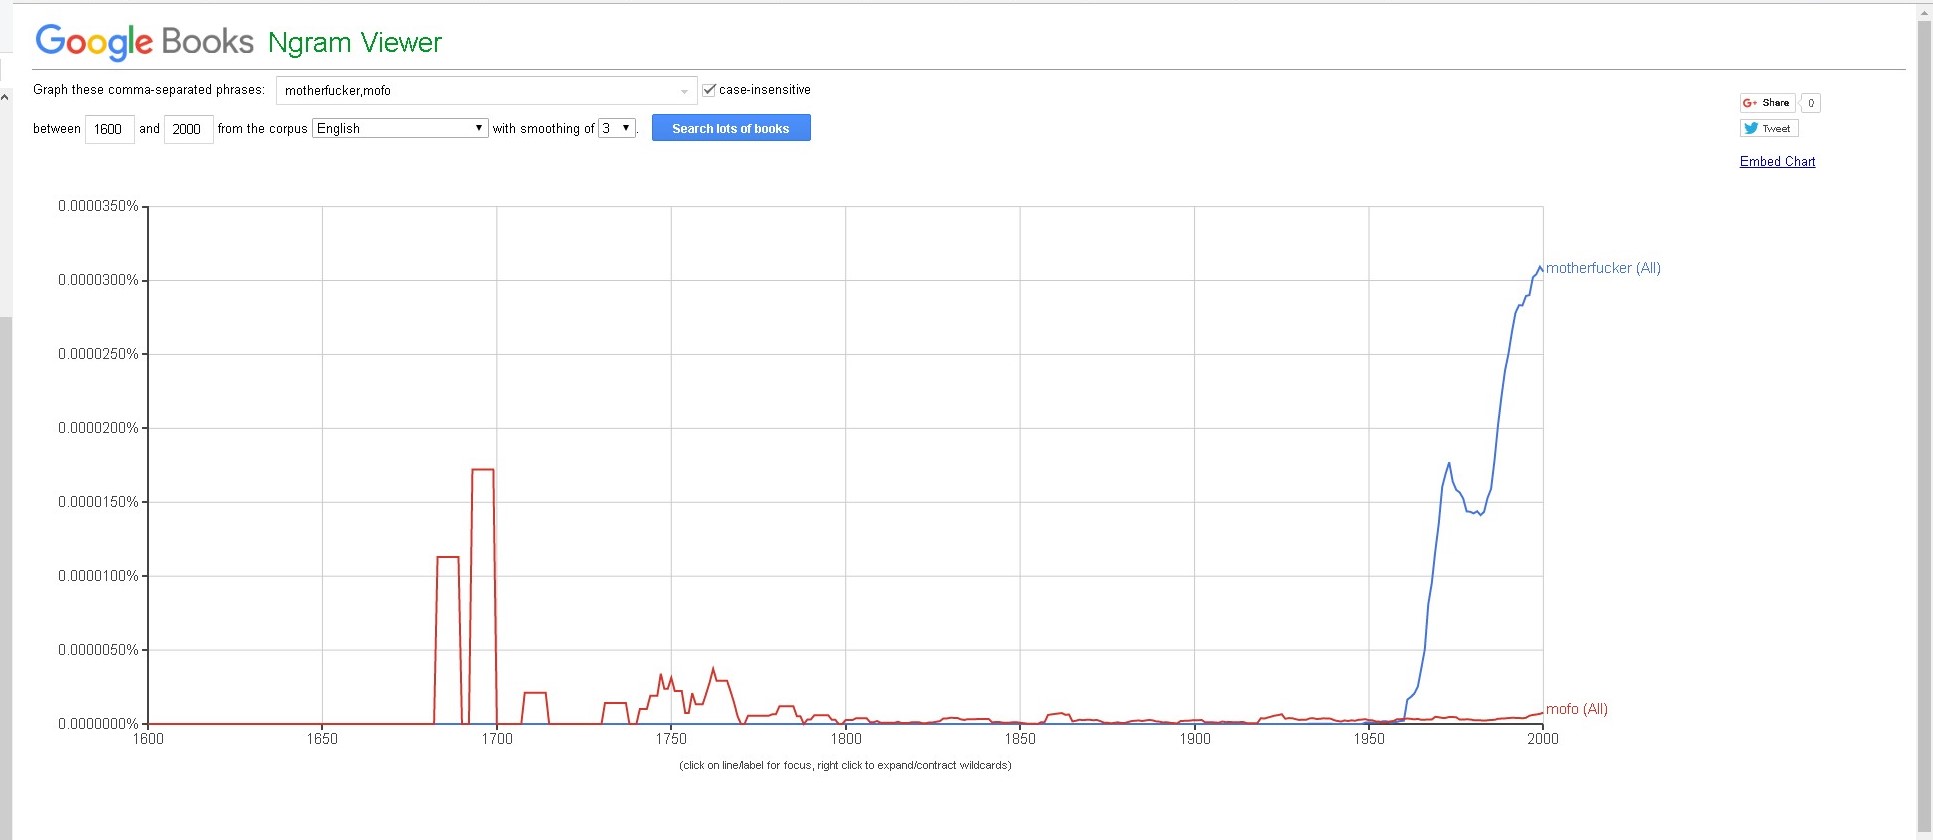
For the “dirty” work search words I chose Samuel L Jacksons favourite “motherfucker” its resurgence since the 1980’s I’d like to think is contributed to Mr Jackson’s colourful use of language.

ngram-mofo

Thankyou Tim, this was another great lesson.

Week 12 Reflection

I found the information presented in ‘Unremembering the forgotten’ Very interesting the fact with just a few lines of code the gender ratio of the scientists involved could be found shows just how easy it can be to find interesting things. The nature of the talk and how it addresses the unpopular side of Australian history, stories that are outside discourse and what digital heritage can possibly do for this kind of history, I found particular interesting the fact that access can never simply be given and that it must be taken to a certain extent. There is much to find on the surface but there is much more beneath, a sort of web based archaeology I guess, it really is exciting. It really can lead to all sorts of things bubbling forth, challenging, intriguing and creepy things, I agree that it really has a potential to make a difference.

For example 80-90percent of the population of the Americas died from smallpox or other factors of european settlement. This figure is absolutely horrific but it does not connect with people. As you have stated faces really do something to people they prompt such a large amount of emotion, therefore it would be interesting and confronting to bring a face to the estimated  2-100 million native americans that died. Perhaps faces that are in turn made of faces and those faces are composed of faces etc, like those montages that create a face out of other images except it just goes deeper and deeper. There are many possibilites perhaps using maps, graphs or other forms of data visualisation.

It really does make you think of the power that digital tools have to make a difference to the way we see each other, the past and ourselves.

Week Eleven – Archiving the Web ?

This week we looked at archiving tools available to use to archive collections, but a lot of these tools could be used to archive other things around the web.

The most useful tool I found was Wayback Machine, a site that allows you to access a bookmarked page as it was the time it was saved. I can see this being a really useful took for my journalism units as often I want to save the top stories for the day if something significant has happened, or view articles before further changes are made they have been updated or edited. Carrying on with journalism and media, this tool would be fantastic to capture news sites stories with impact and significance such as an election or an Olympic triumph. This would be the modern day equivalent to saving the front page of a newspaper for archival purposes, creating a snapshot of a moment.

Jacinta?

css.php